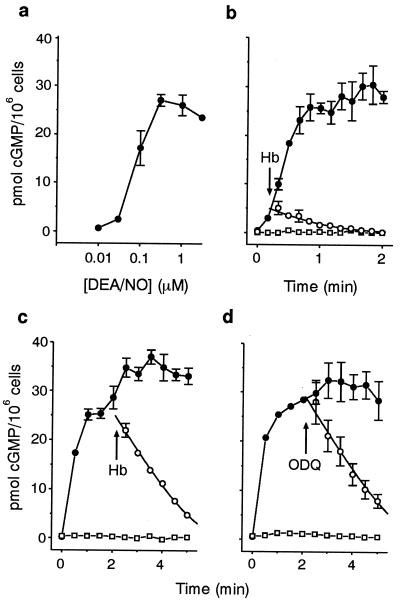
Figure 2.
Characteristics of NO-stimulated cGMP accumulation in cerebellar cells. The concentration–cGMP response curve for DEA/NO (a) was obtained by using a 2-min exposure. Deactivation of sGC was determined by addition of Hb (50 μM) 15 s (b) or 125 s (c) after DEA/NO (1 μM) or by addition of ODQ (10 μM, d). ●, controls; □, Hb or ODQ added 5 s before DEA/NO; ○, Hb or ODQ added at arrows; solid lines fit the decline in cGMP to the Michaelis–Menten equation by using identical parameters (Kp and Vp).

