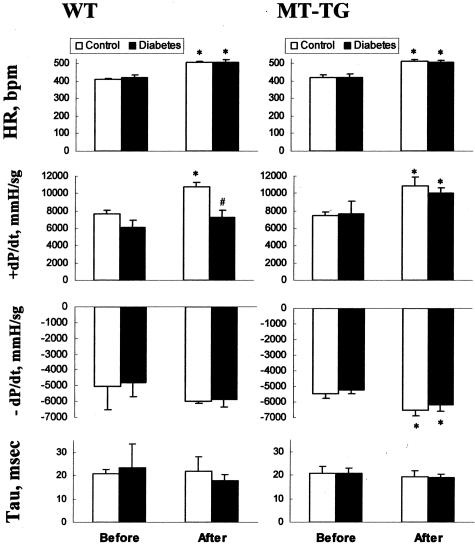
Figure 6.
Comparison of cardiac function changes between MT-TG and WT mice. LV hemodynamic performance was examined in the control (white columns, n = 4) and diabetic (black columns, n = 5 or 6) groups from WT and MT-TG mice. The representative endpoints including HR, +dP/dt, −dP/dt, and tau were examined by basal condition (before) and after isoproterenol stimulating condition (after). *P < 0.05 versus basal line (before); #P < 0.05 versus WT.

