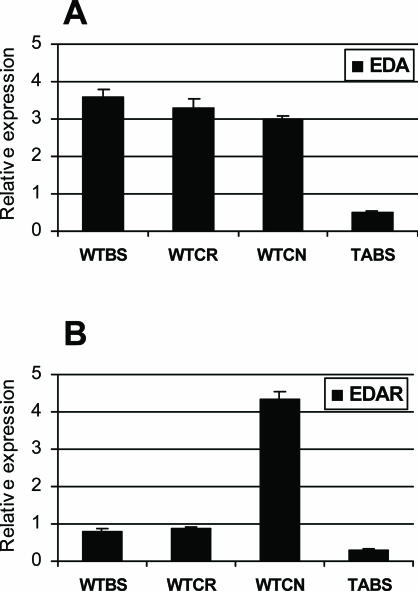
Figure 7.
Quantitative real-time PCR showing expression of EDA and EDAR. Relative expression level of EDA and its receptor, EDAR, in wild-type cornea (WTCR) and conjunctiva (WTCN) compared with wild-type (WTBS) and Tabby (TABS) back skin. Real-time PCR expression levels of EDA (A) and EDAR (B). Data normalized to GAPDH.

