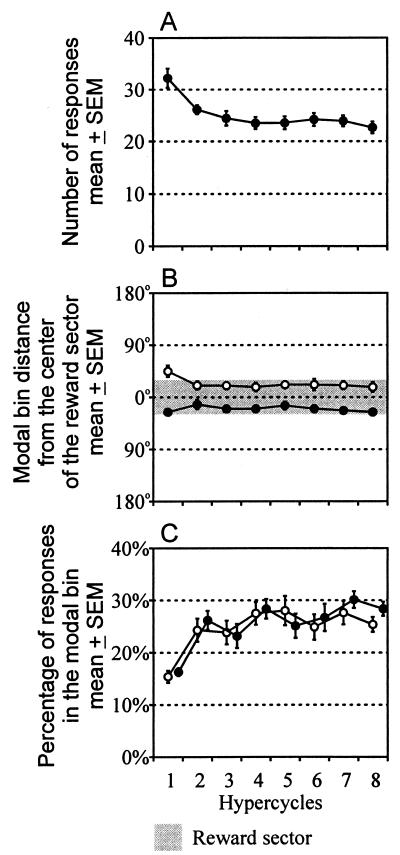
Figure 3.
Development of bar pressing in the eight successive hypercycles forming a session. Means of results obtained in seven rats each trained in four different goal locations. Abscissa: Ordinal number of the hypercycle. (A) Mean (±SEM) number of responses per hypercycle. (B) Mean (±SEM) angular distance of the 20° modal bin of the response histogram from the center of the reward sector. ● and ○ denote CW and CCW rotation, respectively. (C) Mean (±SEM) percentage of responses in the 20° modal bin. ● and ○ denote CW and CCW rotation, respectively.

