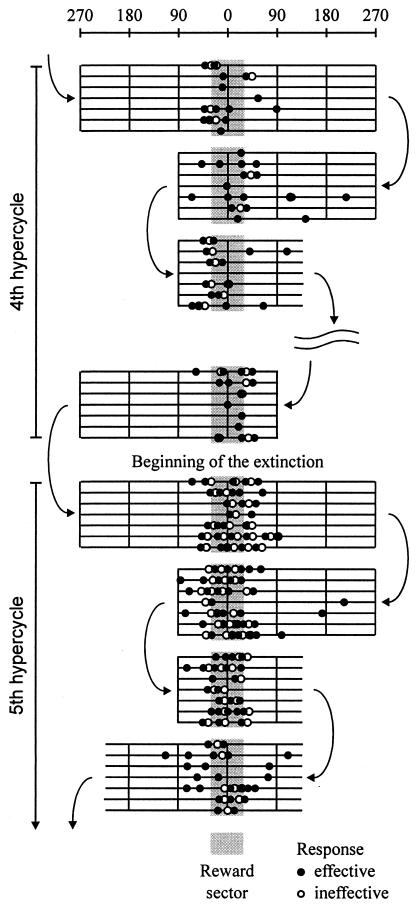
Figure 5.
Transition of rewarded to nonrewarded bar pressing at the onset of extinction. The seven lines in each block indicate the passage of individual rats over the trajectory extent (the upper scale) with the location of each bar press denoted by ● or ○ for the effective and noneffective responses, respectively. The first three blocks in the fourth (rewarded) and the fifth (nonrewarded) hypercycle share the same trajectory. The extinction-induced response change is illustrated by the difference between the last rewarded passage and the first nonrewarded passage through the reward sector. The curved arrows indicate the direction of the passive transport.

