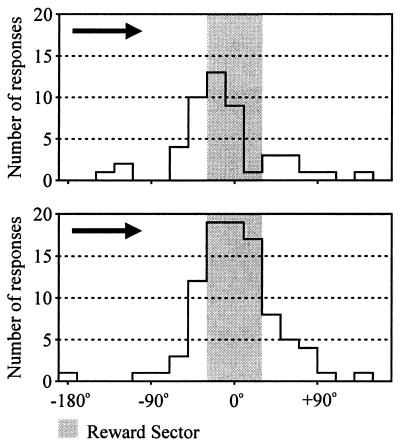
Figure 6.
Histographic comparison of operant responding in the corresponding three rewarded (Upper) and the first three nonrewarded passes (Lower) shown in Fig. 5. Ordinate: Total number of responses emitted by all seven rats. Abscissa: Negative values indicate angular distance from the approaching center of the reward sector, positive values the distance from the already passed center of the reward sector.

