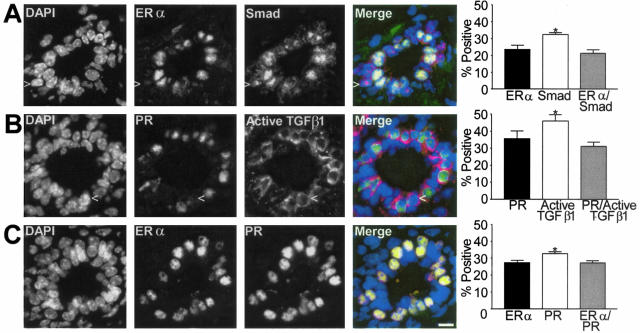
Figure 2.
Subpopulations of the mammary epithelium of the C57BL/6–129SV mixed background mouse at estrus. A: Example of dual-immunofluorescence localization of ER-α and R-Smad immunoreactivity shows the gray scale individual images of DAPI-stained nuclei, ER-α, R-Smad, and a merged color image showing ER-α immunoreactivity as green and nuclear Smad as red which makes nuclei positive for both appear yellow/orange. Column graph shows mean co-localization frequency ± SEM (n = 3). B: Gray scale images of DAPI-stained nuclei, PR, and active TGF-β1 immunostaining in ductal epithelium. The merged color image shows that most PR-positive cells (green nuclei) are also positive for cytoplasmic active TGF-β1 (red). Column graph shows mean co-localization frequency ± SEM (n = 3). C: Individual channels and merged image of ER-α and PR immunoreactivity in a transverse section of a duct. ER-α-positive cells all exhibit PR and the nuclei appear orange in the merged image. Column graph shows mean co-localization frequency ± SEM (n = 3). Scale bar, 20 μm.

