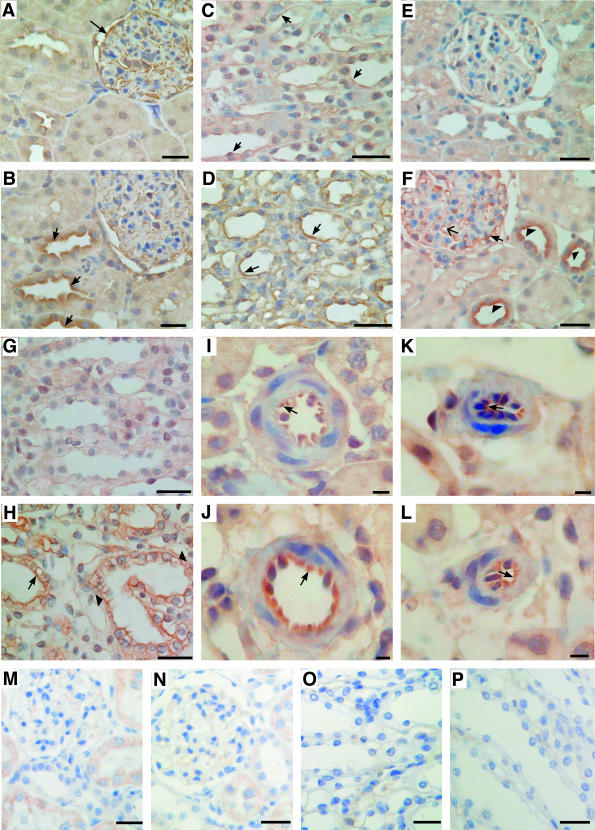
Figure 10.
Expression of A1 and A2a ARs in normal and diabetic kidney. Immunohistochemistry in serial sections of normal (A, C, E, G, I, K, M–P) and diabetic (B, D, F, H, J, L) kidney was performed as described in Materials and Methods. Kidney tissues were stained with antibodies to rat A1 (A–D, M, O) and rat A2a (E–L, N, P) AR. Immunochemistry performed in the presence of A1-AR and A2a-AR blocking peptides is presented in M and O and N and P, respectively. In normal kidney expression of A1-AR was visible in glomerular epithelial cells (A, arrow) and in epithelial cells of medullar tubules (C, arrows). In diabetic kidney A1-AR was up-regulated in epithelial cells of cortical distal convoluted tubules (B, arrow) and medullar tubules (D, arrows). B: Decreased expression of A1-AR was observed in diabetic glomeruli. The expression of A2a AR was barely visible in serial sections of normal kidney cortex (E) and medulla (G) whereas in diabetic kidney cortex (F) A2a-AR was up-regulated in epithelial cells of glomeruli (arrow), in glomerular capillary loops (arrow with a simple wide arrowhead), and in apical membranes of epithelial cells of distal convoluted tubules (arrowhead). H: Immunostaining for A2a-AR was also increased both in luminal (arrow) and basolateral (arrowhead) membranes of epithelial cells of diabetic medullar tubules. J: The A2a-AR staining was also increased in epithelial cells of preglomerular vessels of diabetic kidney (arrow). K and L: Only weak A2a-AR labeling of postglomerular vessels was visible (arrow). Scale bars: 50 μm (A–H, M–P); 10 μm (I–L).

