Figure 5.
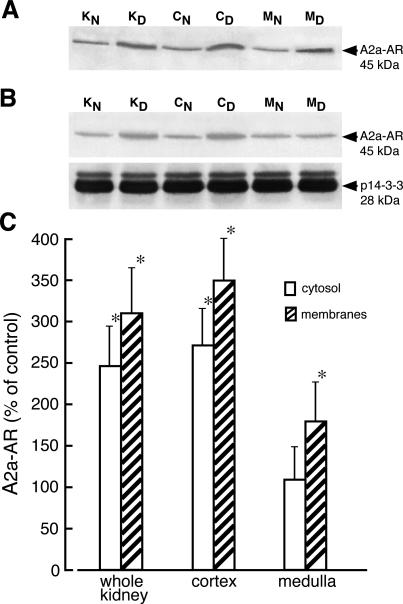
Cellular distribution of adenosine A2a receptor in normal and diabetic kidney. Membrane (A) and cytosolic (B) fractions from whole normal kidney (KN), whole diabetic kidney (KD), normal kidney cortex (CN), diabetic kidney cortex (CD), normal kidney medulla (MN), and diabetic kidney medulla (MD) were prepared as described in Materials and Methods. The proteins (50 μg and 70 μg of membrane and cytosolic protein, respectively) were separated on 12% SDS-PAGE and immunoblotted with appropriate antibodies. The blots were scanned and quantified. C: The quantified results normalized to 14-3-3 protein (for cytosol) are presented as percentage of A2a-AR/p14-3-3 measured in normal (control) tissues + SD of at least four experiments. For membrane fraction the absolute intensities of A2a-AR bands were compared. *P < 0.05 relative to control.

