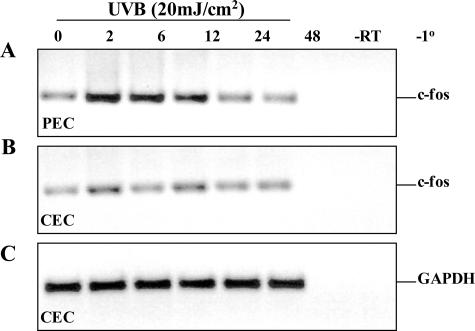
Figure 6.
Differential expression of c-fos in epithelial cells. Semiconfluent cultures of PECs (A) and CECs (B, C) were exposed to 20 mJ/cm2 UVB. Total RNA was isolated at 0 to 48 hours after UVB and analyzed by RT-PCR to determine c-fos (A, B) and GAPDH (C) mRNA levels using gene-specific primers. Control reactions included RNA that was not reverse transcribed (−RT) or reactions in which the primer pairs were omitted (−1°). No products formed in reactions that did not include a DNA template (not shown). Molecular weight of the products was estimated by comparison to a 100-bp ladder.

