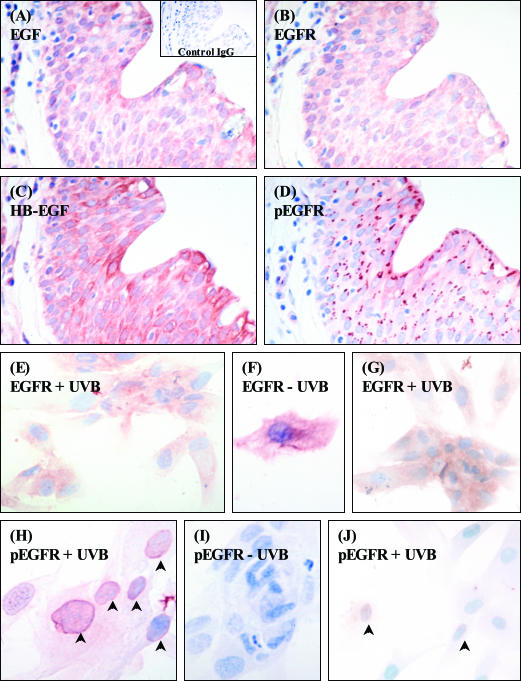
Figure 8.
Expression of the EGFR and its ligands in pterygia and cultured PECs. Serial sections of pterygium (A–D), cultured PECs (E, F, H, I), or CECs (G and J) were stained for the EGFR (B, E–G), the active phosphorylated EGFR (D, H–J), HB-EGF (C), and EGF (A). Control reactions included omitting the primary antibody (not shown) or applying a relevant isotype control IgG antibody (A, inset). Some cells were mock irradiated [−UVB, (F and I)] or exposed to 20 mJ/cm2 UVB [+UVB (E, G, H, J)]. Red staining denoted positive immunoreactivity. All tissue sections and cultured cells were counterstained with hematoxylin. Arrowheads in H and J point to perinuclear immunoreactivity for the phospho-EGFR. This pattern of expression was representative of all diseased tissue specimens and cultured cells analyzed. Original magnifications: ×500 (A–D, E, G, I, J); ×640 (F and H).

