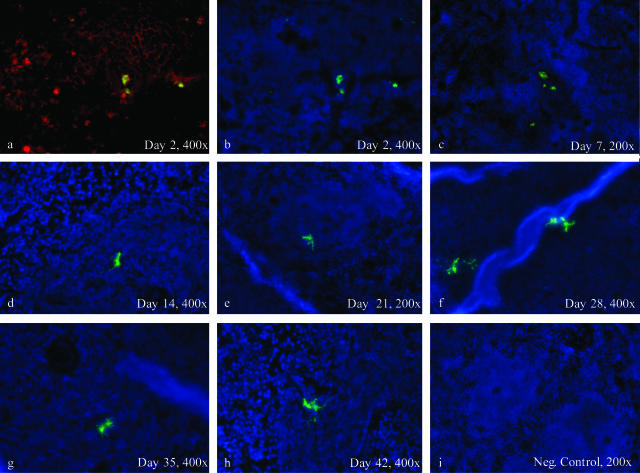
Figure 6.
Time course of eDC migration in the spleens of allogeneic recipients. b to h:gfp+ eDCs (shown in green) could be observed in the periarteriolar lymphatic sheaths (PALS) of the spleen, at all seven time points analyzed in this study (day 2 until day 42). a to c: Although the morphology of eDCs on day 2 and day 7 (b, c) appears somehow immature, by showing a rather macrophage-like phenotype (oval to polygonal shape), immunofluorescence stainings showed a clear positivity (red) for CD11c (a). d: From day 14 on, gfp+ eDCs showed a more mature phenotype with long extended dendrons. e–h: This phenotype could be observed throughout day 42 (6 weeks), while eDCs were still located in the PALS. i: The control tissue of an untreated BALB/c mouse, which had received the same conditioning regimen, without transfer of eDCs, was completely negative in the green channel. Overall the signal-to-noise (background) ratio was successfully enhanced by applying an additional immunofluorescence staining, using an anti-gfp-Alexa-488 conjugate. b to i: Nuclei were counterstained with 4,6-diamidino-2-phenylindole, displayed in blue.

