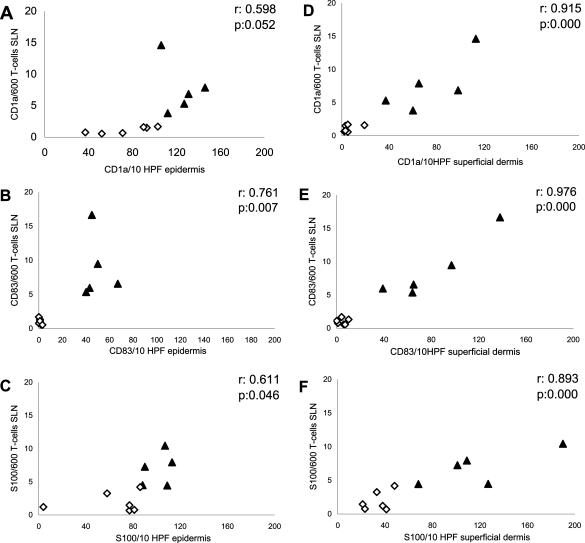
Figure 3.
Correlation between DC numbers in the epidermis or superficial dermis and in the SLN. The numbers of DCs positive for CD1a, CD83, and S100 in the SLN (expressed as number per 600 T cells: quantified on cytospins from SLN cell suspensions), correlated to the number of DCs positive for CD1a (A), CD83 (B), and S100 (C) in the epidermis and CD1a (D), CD83 (E), and S100 (F) in the superficial dermis (all shown as mean numbers per 10 HPFs, HPF at ×400 magnification). ⋄Patients treated with saline; ▴patients treated with GM-CSF. Correlations were calculated using Spearman’s ρ test: r and P values are displayed.

