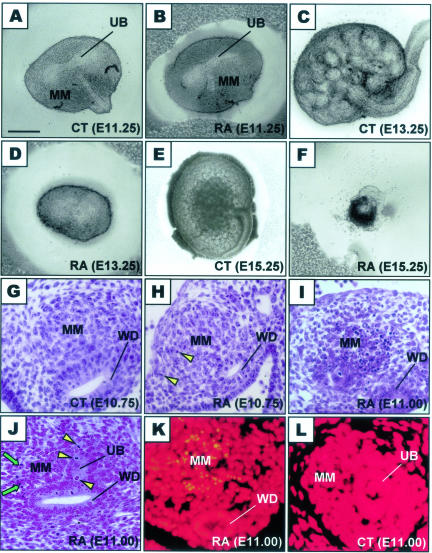
Figure 1.
Comparison of gross morphological and histological appearances of metanephroi from control and RA-exposed embryos. A to F: Metanephroi freshly isolated from control (CT; A, C, and E) and RA-exposed (RA; B, D, and F) embryos at E11.25 (A and B), E13.25 (C and D), and E15.25 (E and F). Note that RA-treated metanephroi (B) showed no apparent gross morphological difference from controls (A) at E11.25, with the UB having branched once and the MM yet to differentiate; in subsequent days, RA-treated metanephroi failed to progress (D) and then degenerated (F). G to L: Transverse histological metanephric sections of control (G and L) and RA-exposed embryos (H–K) at E10.75 (G and H) and E11.00 (I–L) stained by H&E (G–J) or TUNEL method (K and L). Note the condensation of cells around the Wolffian duct (WD) to form MM, which was actively proliferating with many mitotic figures (arrowhead, H) seen. The abundant pyknotic nuclei in the MM at the cranial region of the RA-treated metanephric rudiment (I) were apoptotic bodies (K). At the middle level of the RA-treated metanephric rudiment where the UB had evaginated from the WD and penetrated into the MM, there were many pyknotic nuclei (arrow) in the MM while UB cells were actively dividing (J). Scale bar: 0.2 mm (A–D, F); 0.5 mm (E); 0.05 mm (G–L).

