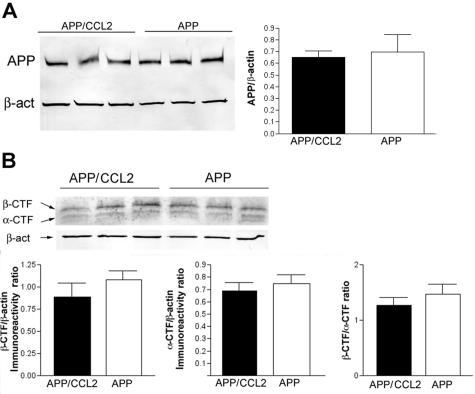
Figure 6.
APP expression and processing. A: Protein extracts from the cortex and the hippocampus of APP/CCL2 and APP mice (n = 3) were subjected to immunoblotting for APP and β-actin using anti-Aβ (6E10) and anti-β-actin monoclonal antibodies. The APP-immunoreactive band intensity was normalized by β-actin band intensity. No statistical significance was observed. B: APP α- and β-CTF protein levels were quantified by immunoblotting using anti-APP 751-770 antibody and normalized by β-actin protein levels in cortex (n = 3). No statistical significance was observed.

