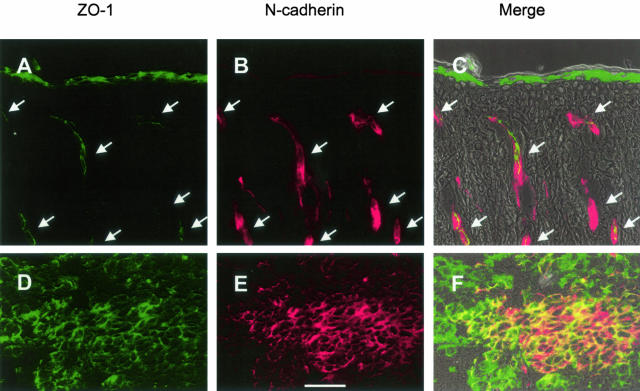
Figure 2.
Expression of ZO-1 in human skin and metastatic melanoma. A–C: Localization of ZO-1 and N-cadherin in human scalp skin. D–F: Localization of ZO-1 and N-cadherin in melanoma metastasis. Immunofluorescence microscopy of ZO-1 is shown in green (A, C, D, F). Expression of N-cadherin is shown in red (B, C, E, F). The corresponding overlay of epifluorescence and phase contrast is shown in C and F. The arrows shown in A to C denote blood vessels. Scale bar, 50 μm.

