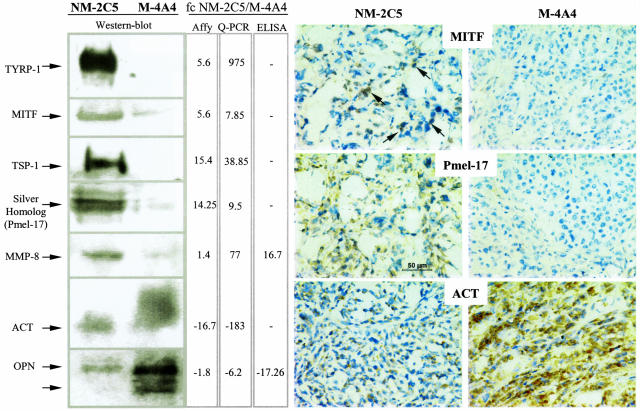
Figure 2.
Protein validations of candidates selected on microarray-based differential expression between the nonmetastatic and the metastatic tumors in BalbC mice. Changes in mRNA expressions estimated by microarray analyses and quantified by real-time PCR (middle columns) were validated at the protein level by quantitative (ELISA, third column) or semiquantitative methods (Western blotting, left; immunohistochemistry, right) as described in Materials and Methods. Both the “Affy” and the “Q-PCR” fold changes came from the Q-PCR validation table provided in the supplemental material. This explains why, for some genes, the microarray data indicated in this figure may not exactly match those in Table 1, which are based on SCID comparisons. All of the stained tumor sections were observed at 400× magnification, and a scale bar was inserted in the NM-2C5 tumor section stained with the anti-Pmel-17 antibody. Arrows in the upper left show examples of positive signals of MITF localization in the nuclei of nonmetastatic tumor cells.

