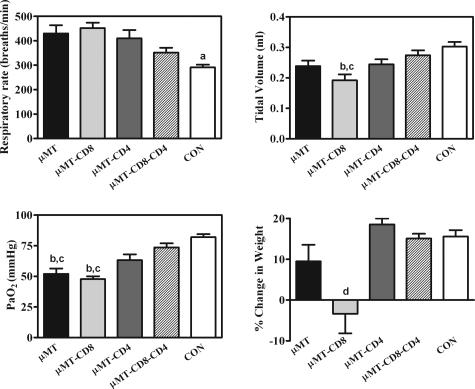
Figure 3.
Physiological assessments of pulmonary damage in μMT mice with various complements of T cells 28 days after inoculation with Pneumocystis. Experimental groups are as described in Figure 2. Respiratory rate (top left) and tidal volume (top right) were measured using whole body plethysmography and are expressed as breaths per minute and ml per breath, respectively. Partial pressure of oxygen was measured in arterial blood taken from the tail artery of mice, and is expressed in mm of mercury (mmHg; bottom left). Body weight of experimental animals was measured at the time of inoculation and at 28 days, and changes in weight are expressed as a percent change of total body mass (bottom right). Values are means ± SEM, n = 5. a = Control mice respiratory rates are significantly lower that all other groups (P ≤ 0.05); b = significantly different from the same parameter in μMT-CD4-CD8 mice (P ≤ 0.05); c = significantly different from the same parameter in control mice (P ≤ 0.05); d = significantly lower than same parameter in all other groups of mice (P ≤ 0.01).

