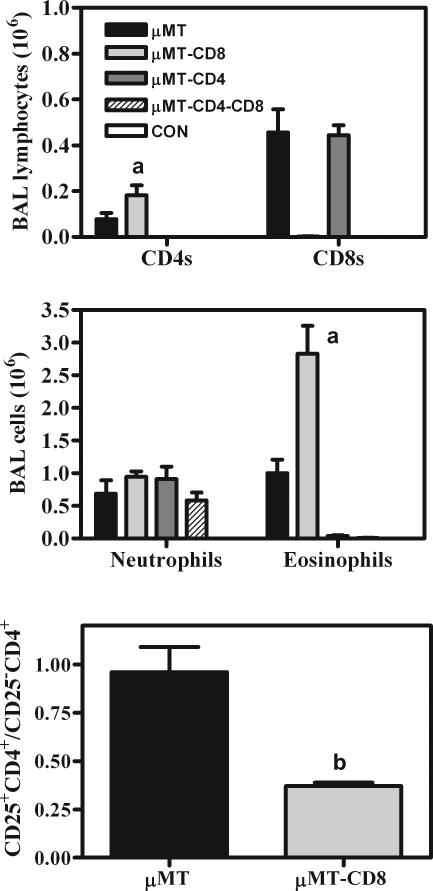
Figure 4.
Inflammatory cells in the BALF of μMT with various complements of T cells 28 days after inoculation with Pneumocystis. See Figure 1 legend for methodology. Experimental groups are as described in Figure 2. Top: Cell types shown are CD8 lymphocytes (CD8) and CD4 lymphocytes (CD4). Middle: Cell types shown are neutrophils and eosinophils. Bottom: Ratio of putative CD4 suppressor T cells to CD4 effector T cells (total numbers of CD25+ CD4 lymphocytes divided by total numbers of CD25-CD4 lymphocytes) in the BALF of μMT mice with and without CD8 T cells being present 28 days after inoculation with Pneumocystis. Values are means ± SEM, n = 5 for each group; a = significantly greater than in μMT mice (P ≤ 0.05); b = significantly greater than in μMT mice (P ≤ 0.05).

