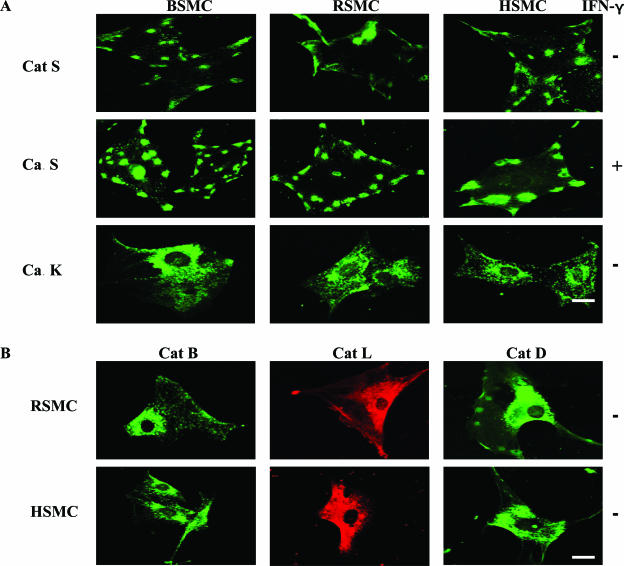
Figure 3.
Distribution of Cats in SMC intracellular region visualized by immunofluorescence. After being attached to coverslips precoated with type I collagen, cells were cultured in the presence or absence of IFN-γ for 24 hours, fixed, and then stained as described in the Materials and Methods section. Single immunostaining was performed with the pAbs (FITC, green) to Cat S (A: top, no treatment; middle, treated with IFN-γ), Cat K (A, bottom), Cat B (B, left), Cat D (B, right), or the mAb to Cat L (Alexa, red; B, middle). Scale bars, 10 μm.

