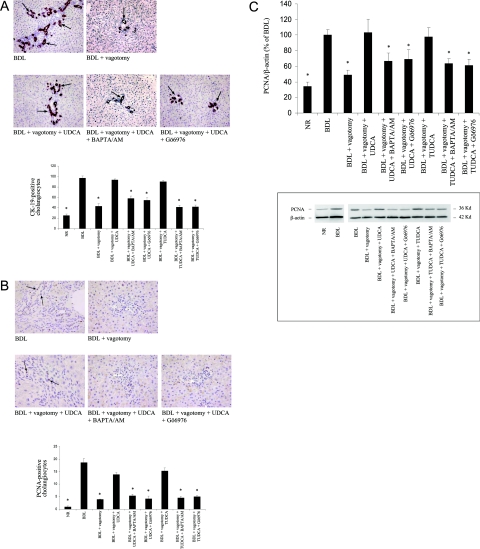
Figure 2.
Evaluation of cholangiocyte proliferation. A: Quantitative CK-19 immunohistochemistry in liver sections obtained from rats of the different experimental groups. Top: Representative images of the immunohistochemical reaction. Positive bile ducts are denoted by arrows. Bottom: The quantitative analysis (n = 3). B: Quantitative PCNA immunohistochemistry in liver sections from rats of the different experimental groups. The top part displays representative images of the immunohistochemical reaction; positive cholangiocytes are denoted by arrows (n = 3). C: PCNA protein expression, measured by immunoblot, in cholangiocytes freshly isolated from rats of the different experimental groups. Top: Quantitative data of the changes in PCNA protein expression (to compare NR cholangiocyte values, obtained in different experimental sets, data are expressed as percentage of BDL value, n = 3). Bottom: Representative images of the immunoblots PCNA and β-actin. Data are mean ± SEM of three experiments. *P < 0.05 versus BDL, BDL + vagotomy + UDCA, and BDL + vagotomy + TUDCA. Original magnifications: ×250 (A); ×1000 (B).

