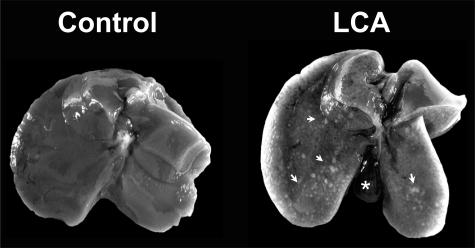
Figure 1.
Macroscopic appearance of the liver in lithocholic acid-fed mice. Compared with the control liver on the left, the liver from a mouse fed a 1% (w/w) LCA-supplemented diet for 4 days is enlarged and shows numerous small necrotic areas (ie, bile infarcts) on its surface (indicated by arrows). Note also the enlarged gall bladder in the LCA-fed mouse liver (indicated by the asterisk).

