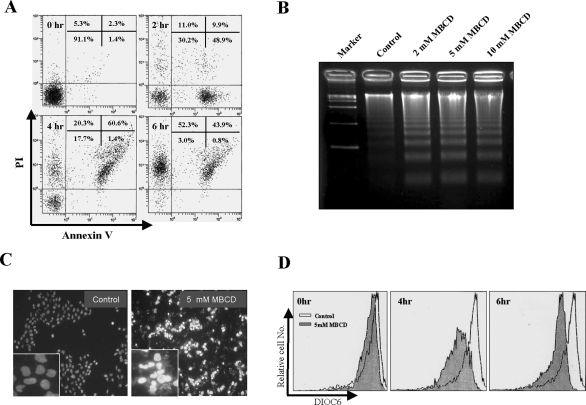
Figure 2.
Apoptotic features of MBCD-induced cell death. A: A431 cells were treated with 5 mmol/L MBCD, stained with annexin V-FITC and PI, and subjected to flow cytometry analysis. Fluorescence dot blots of annexin V-positive (horizontal axis) and PI-positive (vertical axis) cells are shown. Cells that were positively stained by annexin V-FITC only (early apoptosis) and positive for both annexin V-FITC and PI (late apoptosis) were quantitated, and both subpopulations were considered as overall apoptotic cells. B: A431 cells were treated with 2, 5, and 10 mmol/L MBCD for 4 hours, and DNA was isolated and analyzed by 2% agarose gel electrophoresis. C: Cells were treated with 5 mmol/L MBCD for 4 hours, stained with DAPI, and analyzed by fluorescence microscopy. D: A431 cells were treated without or with 5 mmol/L MBCD for 4 and 6 hours and then incubated with DiOC6 to monitor ΔΨm by FACS. The loss of mitochondrial membrane potential was equated with decreased fluorescence and shift to the left. These experiments were repeated three separate times with comparable results.

