Figure 7.
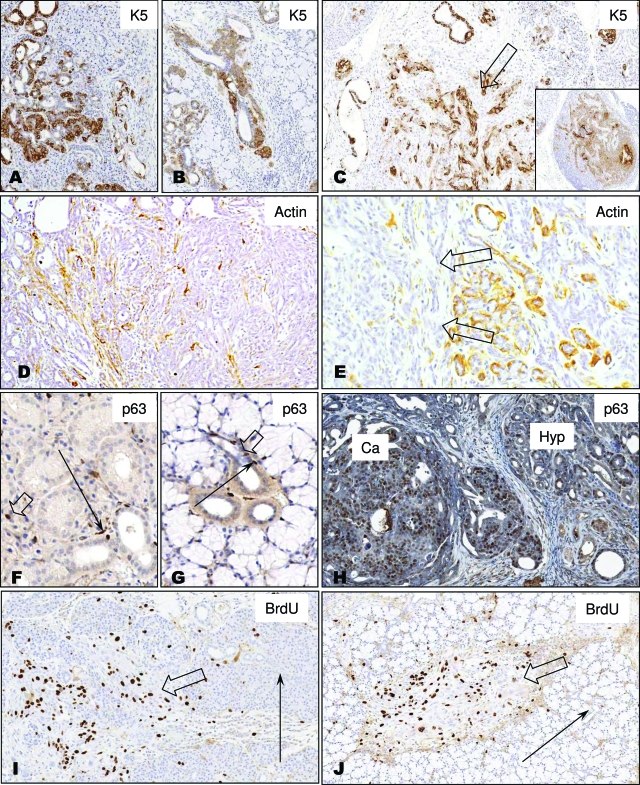
A and B: K5 staining in the hyperplastic area of the submaxillary and sublingual glands, respectively, showing strong immunoreactivity in the proliferating cells. C: Strong K5 immunoreactivity in carcinomatous cells (arrow), as well as in a lymph node metastasis (inset). D: Distribution of smooth muscle actin staining in a dysplasia, with scattered cells surrounding glandular structures. In E, the carcinomatous area on the left side of the picture is negative (arrows), whereas the hyperplastic glands on the right side show positive periglandular myoepithelial cells. F and G: Scattered immunoreactivity for p63 in normal submaxillary and sublingual glands respectively (empty arrows: ductal cells; arrows: myoepithelial cells). In H, a higher number of p63-immunoreactive cells are seen in the carcinomatous (Ca) as compared with a hyperplastic area (Hyp). In both cases the proportion of positive cells is higher than that of normal tissues. I and J: a higher proportion of BrdU-retaining cells in hyperplastic areas (empty arrows) as compared with normal areas (arrows) in submaxillary and sublingual glands, respectively. Magnifications: ×30 (A–C); ×40 (D, E, H, I, and J); and ×60 (F and G).

