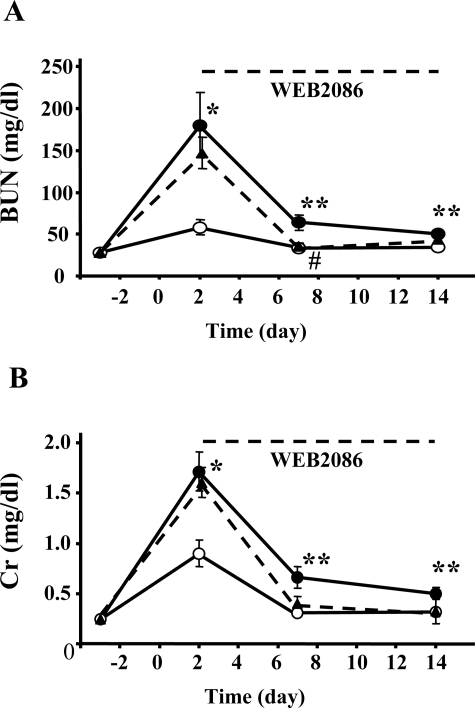
Figure 1.
Time course of BUN (A) and Cr (B) levels in PAFR-KO and PAFR-WT mice subjected to FA administration. Filled circles indicate PAFR-WT mice, open circles indicate PAFR-KO mice, and filled triangles indicate WEB2086-treated PAFR-WT mice. WEB2086 was injected every day from days 2 to 14. The numbers of animals were 16 at days −3 and 2, 8 at days 7 and 14 in PAFR-WT and PAFR-KO mice, and 5 in WEB2086-treated PAFR-WT mice. *P < 0.005, **P < 0.05 (PAFR-WT versus PAFR-KO). #P < 0.05 (PAFR-WT versus WEB2086-treated PAFR-WT).

