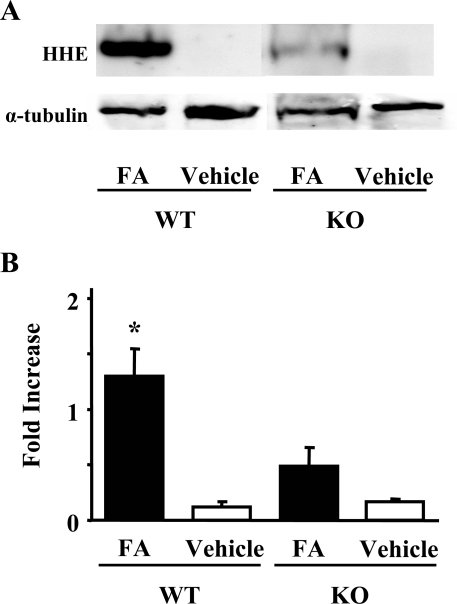
Figure 4.
Western blot analysis of HHE-modified protein expression in kidney homogenates at day 2. A representative image is shown in A (top). B: The histogram depicts the relative density of bands in comparison with α-tubulin. Five animals were in the FA group; three received the vehicle. *P < 0.05 versus PAFR-KO mice with FA administration.

