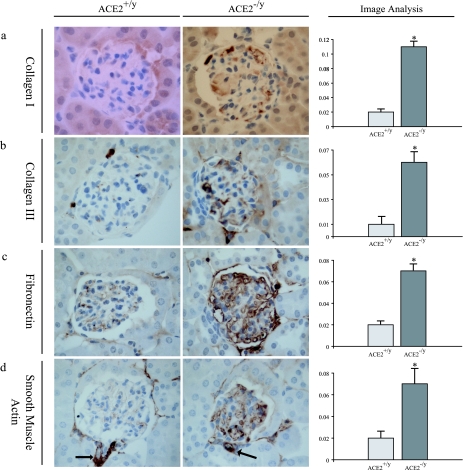
Figure 4.
Glomerular immunohistochemical profile of 1-year-old ACE2+/y and ACE2−/y mice. Far right panel shows computer image analysis scores of glomerular immunostaining. a: Collagen I. b: Collagen III. c: Fibronectin. d: α-Smooth muscle actin. As expected arterioles exhibit positive α-smooth muscle actin staining (arrows) in both ACE2+/yand ACE2−/y mice. Immunoperoxidase, original magnification, ×600 (a–d). *P < 0.05 versus ACE2+/y.

