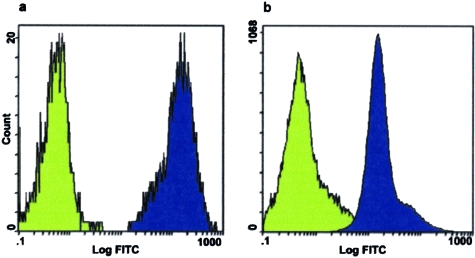
Figure 2.
Indirect immunofluorescence assays indicating HTR-8/SVneo cell-surface expression of AAV-2 receptors. Fluorescence intensity was measured in cells that were incubated with monoclonal antibodies against heparan sulfate (a) or αVβ5 integrin (b) and fluorescein-conjugated secondary antibody (blue-shaded curves) and in cells that were incubated with fluorescein-conjugated secondary antibody alone (green-shaded curves). The y axis indicates cell number, and the x axis indicates logarithm of fluorescence intensity.

