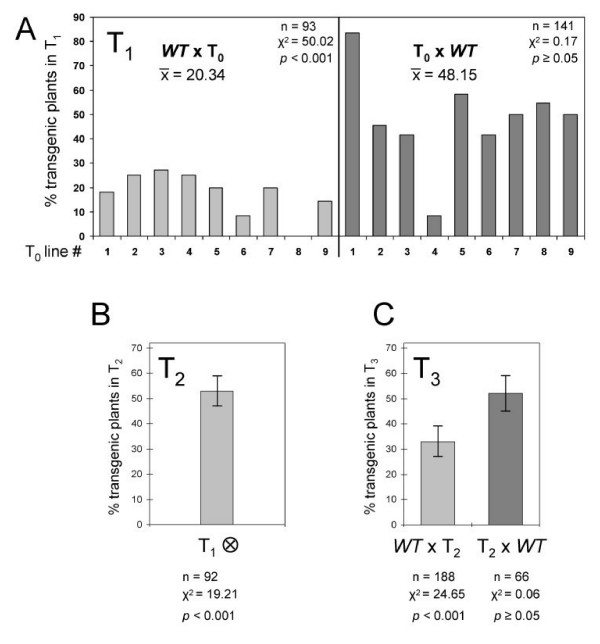
Figure 8.
Genetic segregation analyses of transgenic ZmPti1a-RNAi plants. (A) T0 plants expressing a ZmPti1a directed RNAi construct were crossed reciprocally to wild type A188. Transmission of the RNAi transgene was scored in T1 siblings of each line as a percentage of 'transgenic PPT-resistant plants' to 'PPT-sensitive plants'. The progeny of wild type plants pollinated with pollen of transgenic plants (left) showed a significant difference from a 1:1 segregation ratio with a lower than expected marker transmission (Probability value based on χ2 test p < 0.001; n = number of individuals analyzed). (B) T1 transgenics were selfed and transmission of the transgene was scored in the T2 progeny as described. Plants showed a significant difference from the expected 3:1 segregation with a lower than expected marker transmission of only 53%. (C) Eight different heterozygous T2 transgenic plants were reciprocally crossed to wild type A188. Marker transmission was scored as described. Only the T3 progeny of wild type plants pollinated with pollen of transgenic plants showed a difference from a 1:1 segregation ratio. Marker transmission was significantly lowered to 33%.

