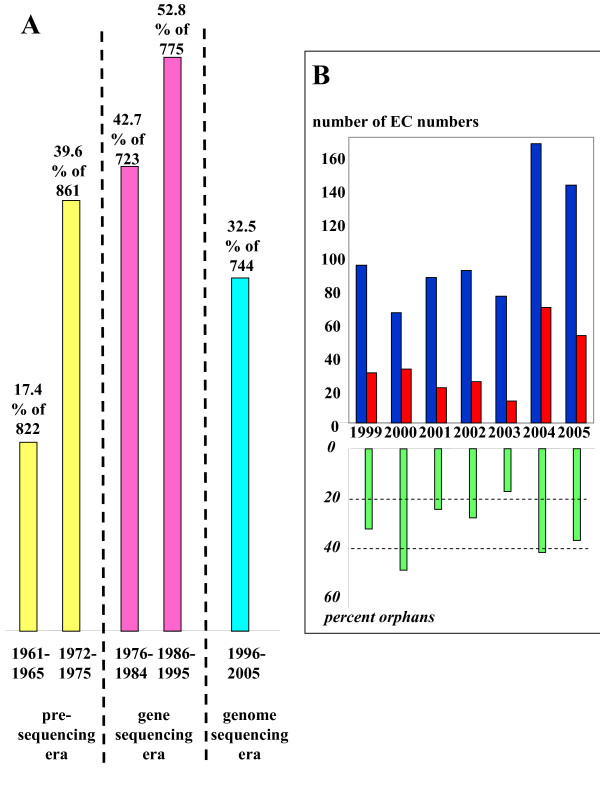
Figure 5.
Distribution of the creation year of orphan enzyme activities. 5A. Distribution during the pre-sequencing era (yellow), the gene sequencing era (pink) and the genome sequencing era (cyan). 5B Number of enzymes created within the past seven years that have/lack sequence data. Total number of EC numbers is in blue, total number of orphan EC numbers in red and percentage of orphans in green.

