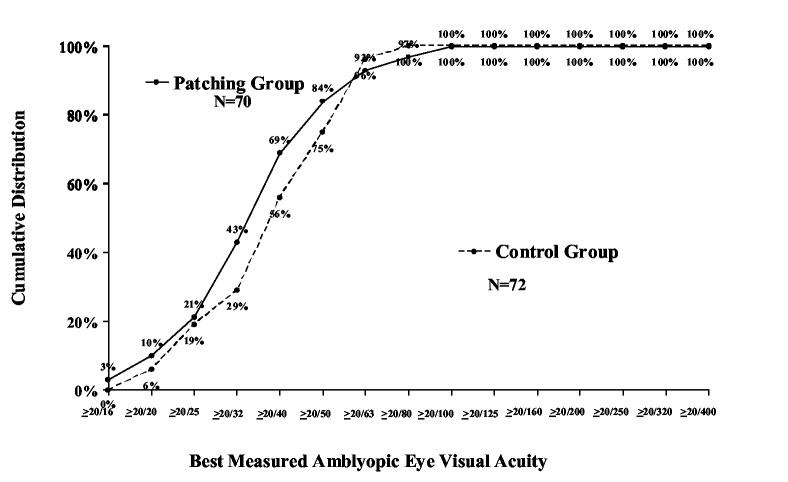
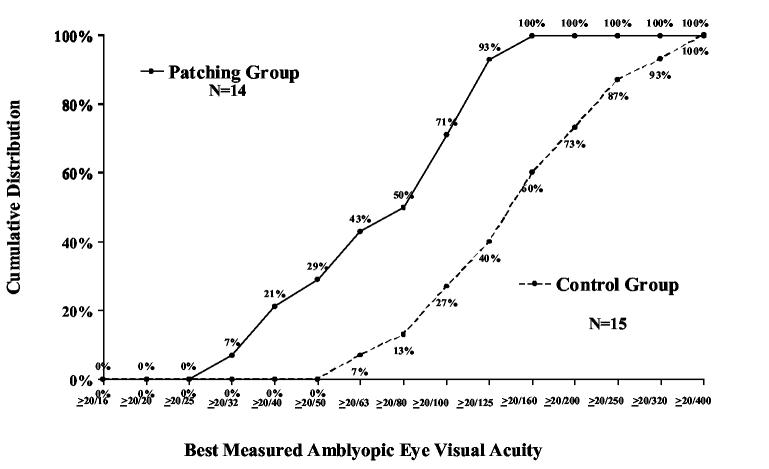
Figure 2.
Cumulative distribution of best measured amblyopic eye visual acuity scores obtained at any study visit according to group assignment at randomization – primary cohort. A. Patients with moderate amblyopia at baseline (20/40-20/100). B. Patients with severe amblyopia at baseline (20/125-20/400).


