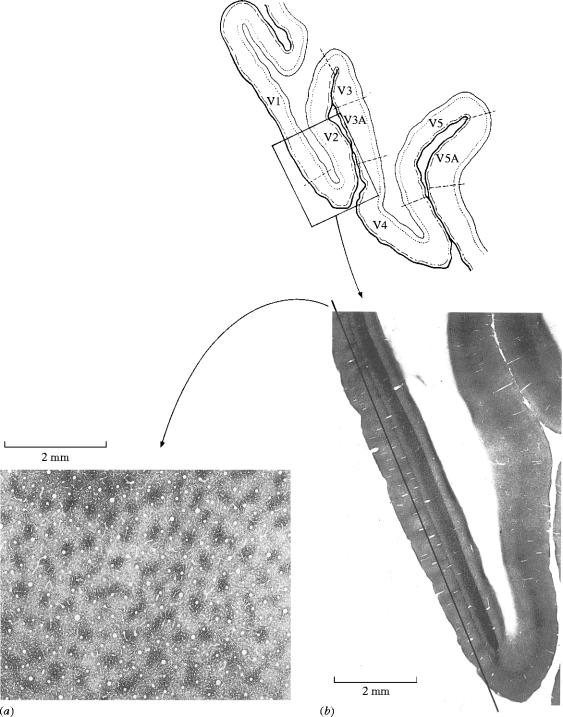
Figure 5.
The cytochrome oxidase architecture of area V1 (a) is characterized by a set of darkly staining ‘blobs’, which are separated from each other by more lightly staining ‘interblob’ regions. This architecture is best revealed when a section that is parallel to the surface is taken through area V1 (b) and stained for the metabolic enzyme. The tracing above shows the region of the occipital lobe from which the section in (b) was taken. (From Zeki 1993a.)

