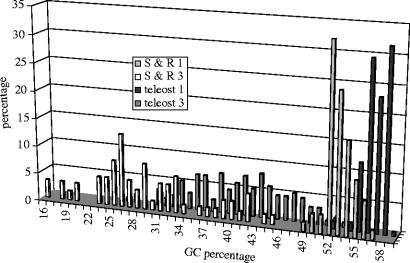
Figure 2.
Variation in GC content for coxI among two groups of fishes. The first, second, third and fourth rows plot the GC content of sharks and rays codon position 1, sharks and rays codon position 3, teleosts codon position 1 and teleosts codon position 3, respectively. Codon position 2 is not shown as this shows very little variation within and among the two fish groups (table 3).

