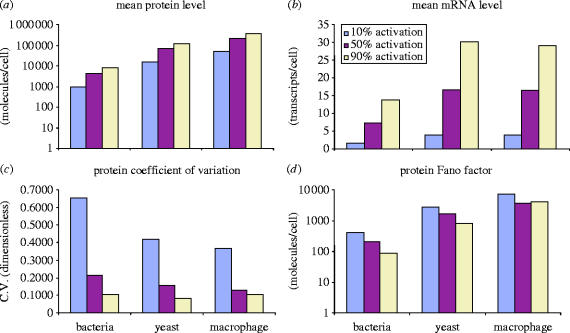
Figure 9.
Cross-species comparison of simulated gene expression noise. The results of steady-state stochastic simulations of our model of gene expression for parameters corresponding to three species are summarized. The bacterial species is E. coli; the yeast species is S. cerevisiae; the macrophage parameters were taken from mammalian data. Three different cases were simulated, corresponding to 10, 50 and 90% gene activation. (a) Average protein level is shown, on a semi-log chart. (b) Average mRNA level is shown. Yeast and macrophage have a comparable average number of transcripts in this simulation. (c) The coefficient of variation (standard deviation over the mean) of protein abundance is shown. The results are qualitatively consistent with the formula of Elowitz et al. (2002), , where ηint2 is the intrinsic noise, m is the level of expression and c1 and c2 are constants. (d) The protein Fano factor (variance over the mean) is shown. For the macrophage, the protein Fano factor appears to saturate above 50% gene expression, indicating that a minimum scale of protein variability is expected regardless of the expression level.

