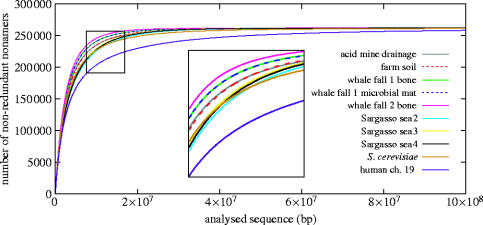
Figure 2.
DNA complexity analysis. The curves show the simulated accumulation of nonamer occurrences (each distinct nonamer is counted only once), generated by random sampling of nonamers from the environmental sequences. As controls, the genome of Saccharomyces cerevisiae, and the human chromosome 19 were similarly sampled. The maximum number of 262 144 (49) distinct nonamers was reached in each environmental sample after analysing a total sequence length in the order of 108 bp.

