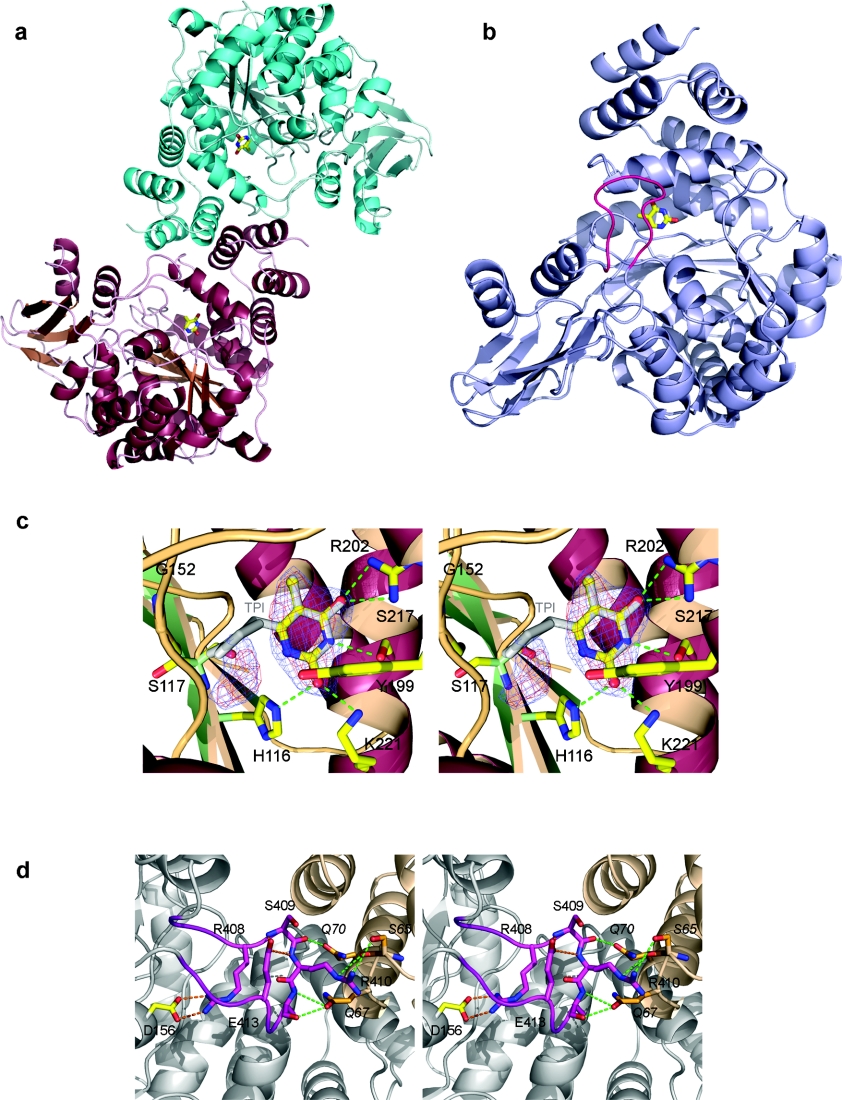
Figure 1. Crystal structure of HTP.
(a) Diagram showing the HTP dimer and the dimerization interface; the thymines present in the active sites are drawn as sticks. (b) Ribbon diagram showing the overall fold of the HTP monomer drawn in light blue. The loop region (405–415) is coloured in pink and the thymine is drawn as sticks. (c) Stereodiagram showing the hydrogen-bonding (green) of thymine to the HTP active site. The inhibitor TPI is superimposed on to the thymine. The final 2Fo−Fc electron density is contoured at 1σ and coloured in blue. The Fo−Fc omit map is contoured at 1.6σ and coloured in red. The additional electron density feature can be seen to the left of the thymine. Relative to (b), the active site is orientated looking towards the thymine through the 405–415 loop, with a 90° clockwise rotation. (d) Stereodiagram showing the interaction of the 405–415 loop coloured in pink, with the two subunits coloured in grey and wheat. Intra-chain hydrogen bonds are coloured in orange, whereas inter-chains hydrogen bonds are coloured in green. The molecule is rotated clockwise by 90° relative to the view in (b).

