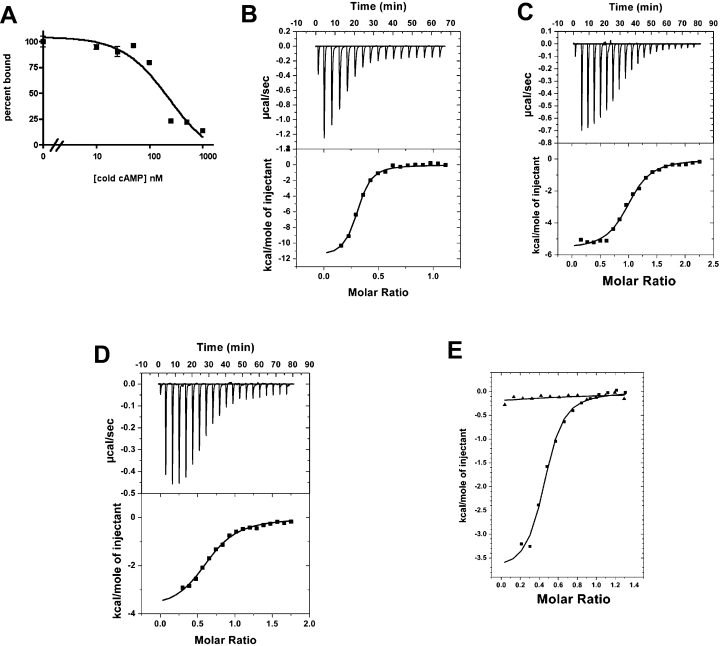
Figure 5. Binding of cAMP to the GAF-A domains of TcrPDEB1 and TcrPDEB2.
(A) Competitive binding curve of cAMP to the NT+GAF-A domain of TcrPDEB2, with cAMP used to displace [3H]cAMP. (B) ITC titration curve showing binding of cAMP to the NT+GAF-A domain of TcrPDEB2. (C) ITC titration curve showing binding of cAMP to the NT+GAF-A domain of TcrPDEB1. (D) Binding of cGMP to the NT+GAF-A domain of TcrPDEB2. (E) Relative heats of binding for cGMP (▲) and cAMP (■) for the NT+GAF-A TcrPDEB1. 1 μcal=4.184 μJ.

