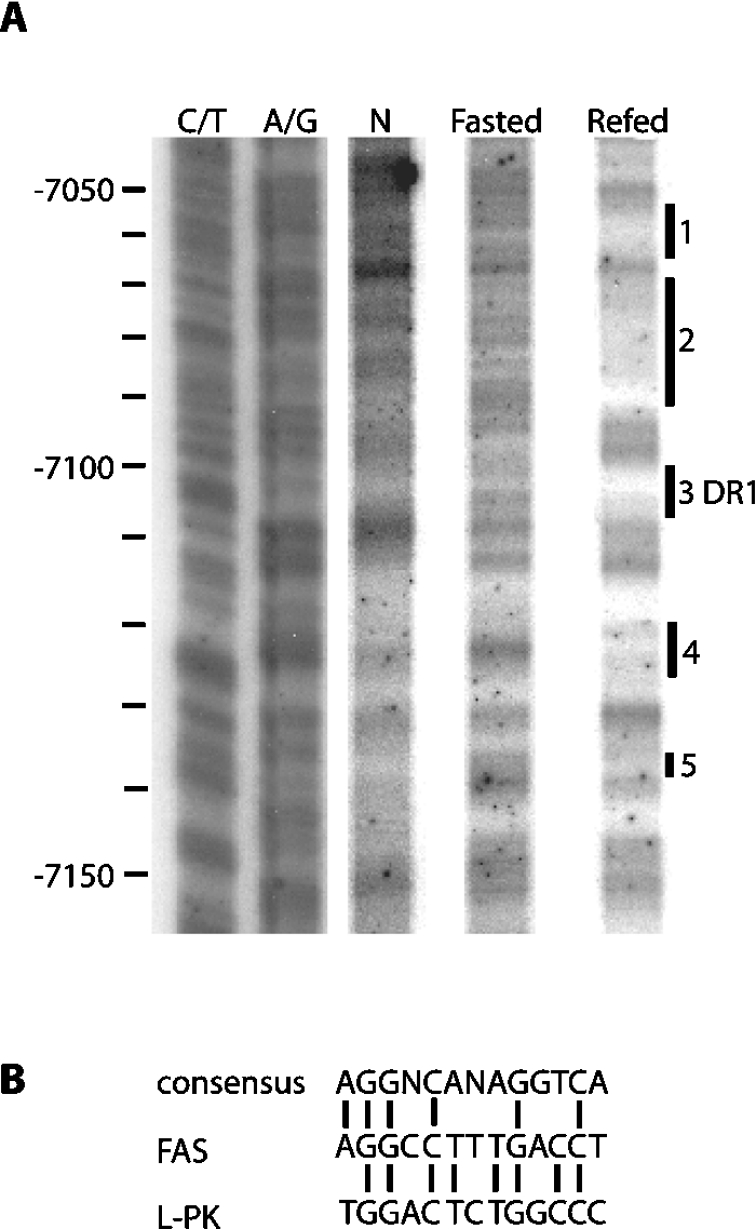
Figure 1. In vivo DNase I footprint analysis of the rat liver FAS gene region of −7150/−7050.
(A) Nuclei isolated from liver of fasted and fasted-refed rats were digested with DNase I as described in the Experimental section. The Figure represents the DNase I footprint of the sense strand of the FAS promoter from −7150 to −7050. The end points of the protected regions were identified by chemical sequencing (C/T and G/A lanes). Areas affected by refeeding are labelled as 1–5. Sequences 1, 2, 4 and 5 bind unknown factors, while sequence 3 represents the DR1. (B) The sequence of the FAS DR-1 element was compared with that of the consensus DR-1 and L-PK gene.

