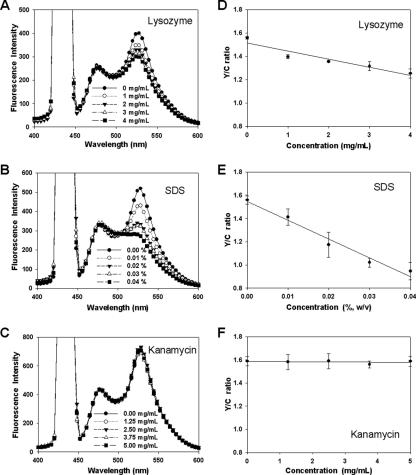
FIG. 4.
pH-controlled FRET assays with a fluorescence spectrophotometer for other nonpeptide compounds. The emission spectra for samples treated with various concentrations of (A) lysozyme, (B) SDS, or (C) kanamycin were scanned following excitation at 433 nm. The Y/C ratios for (D) lysozyme, (E) SDS, or (F) kanamycin were plotted according to the applied amount of each agent. Each measured value and error bar represents the mean for three independent experiments and the standard deviation.

