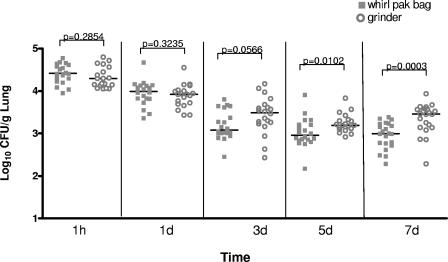
FIG. 3.
Comparison of two methodologies of tissue homogenization for the determination of pulmonary fungal burden. The fungal burden at each time point by each method is shown, combining the results from both laboratories (20 mice per homogenization method per time point). Bars indicate the mean fungal burden. For each laboratory, all mice were infected at the same time and then randomly divided into groups for evaluation using each method.

