Figure 2.

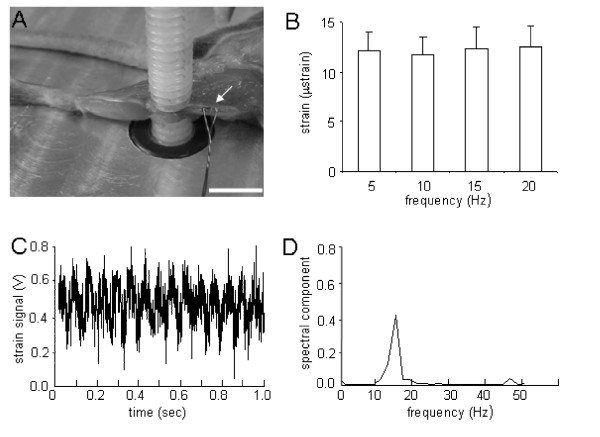
Strain measurement with knee loading. (A) Mouse femoral diaphysis showing a strain gauge attached at the midpoint in the femur. Scale bar = 5 mm. (B) Measured strains in response to loads of 0.5 N forces applied to the knee with the loading frequency at 5, 10, 15 and 20 Hz. The results are expressed as mean ± SEM. (C) Representative strain signal in a time domain in response to knee loading at 15 Hz. (D) Strain signal in a frequency domain in response to loads at 15 Hz.
