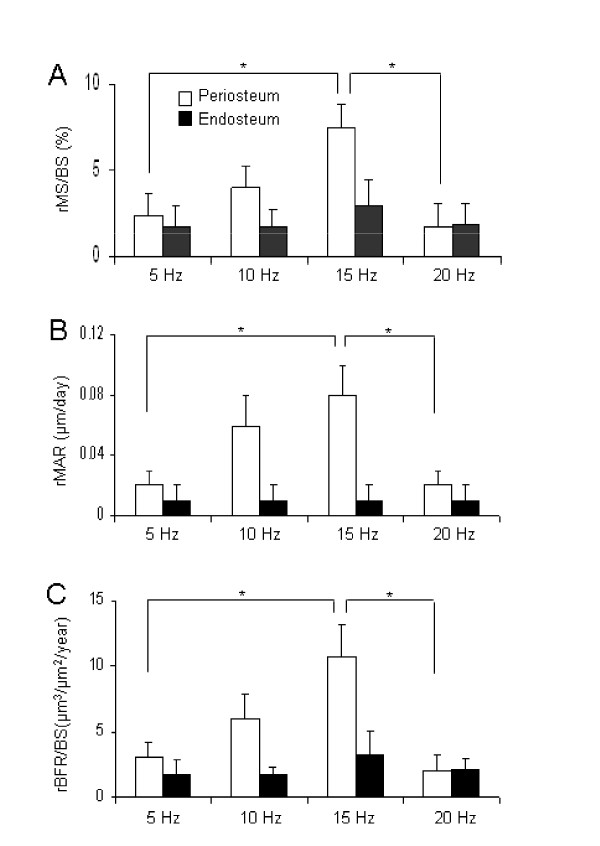
Figure 4.

Alteration in the histomorphometric parameters on the periosteal and endosteal surfaces with knee loading at 5, 10, 15, and 20 Hz. The results are expressed as mean ± SEM. Single asterisks indicate p < 0.05 in Fisher's PLSD. (A) Relative MS/BS (%). (B) Relative MAR (μm/day). (C) Relative BFR/BS (μm3/μm2/year).
