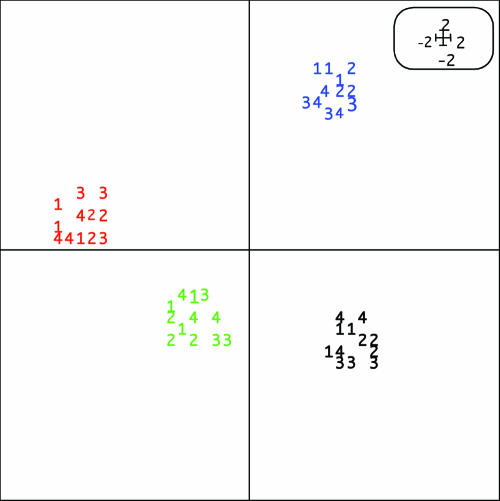
FIG. 2.
Ordination diagram from CA of T-RFLP data derived from surface sediment (0 to 2 cm) of triplicate sediment cores collected from Örserumsviken before and after dredging. Numbers correspond to sampling sites. Color labeling: red, actively growing bacterial community before dredging; blue, actively growing bacterial community after dredging; green, total bacterial community before dredging; black, total bacterial community after dredging. Distances between the profiles that clustered together were significant (P < 0.001). Eigenvalues for first and second ordination axes were 37% and 32%, respectively.

