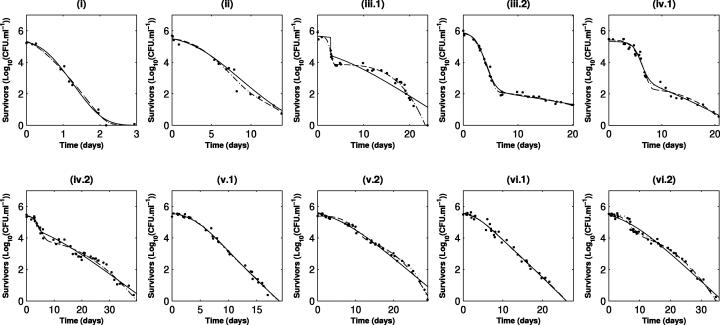
FIG. 3.
Evolution of the shape of survival curves for L. monocytogenes and fitted curves for the models. Solid line, Whiting's model (model 1); dotted line, model 2; dashed line, simplified model 3. The data obtained are indicated by symbols. i, ii, iii, iv, v, and vi indicate the characteristic phases of growth from which the inocula used for inactivation kinetics analysis were obtained (see the legend to Fig. 1); 1 and 2 indicate repetitions.

