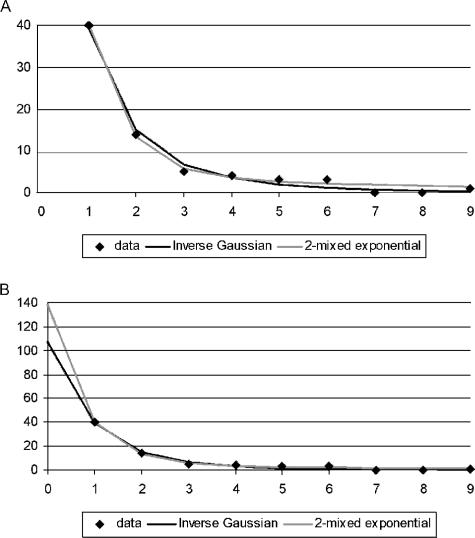
FIG. 1.
Inverse Gaussian-mixed Poisson and mixture-of-two-geometrics frequency count distributions fitted to 97% OTU data. The inverse Gaussian-mixed Poisson distribution was calculated as follows:
 |
(1) |
where j = 0, 1, and so forth, t1 = 0.3431, and t2 = 0.7959. The mixture-of-two-geometrics distribution was calculated as follows:
 |
(2) |
where j = 0, 1, and so forth, t1 = 0.3672, t2 = 7.2341, and t3 = 0.8220. (A) Frequency count distribution fitted to frequency data. (B) Fitted frequency count distribution extended to zero.

