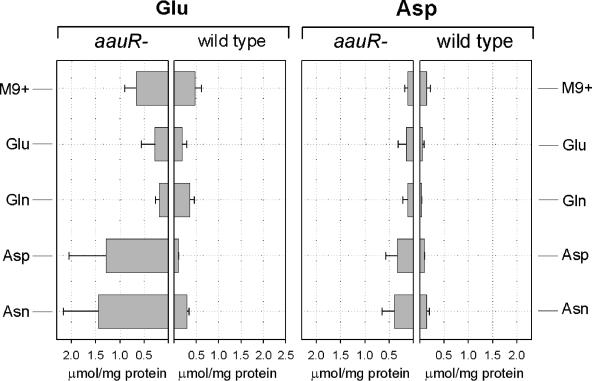
FIG. 6.
Intracellular concentrations of glutamate and aspartate (expressed as μmol per mg of cellular protein) as a function of time after transfer to M9+ medium or to M9 minimal medium containing 10 mM each of Glu, Gln, Asp, and Asn. The error bars indicate standard deviations. The means ± standard deviations were determined from at least three independent experiments.

