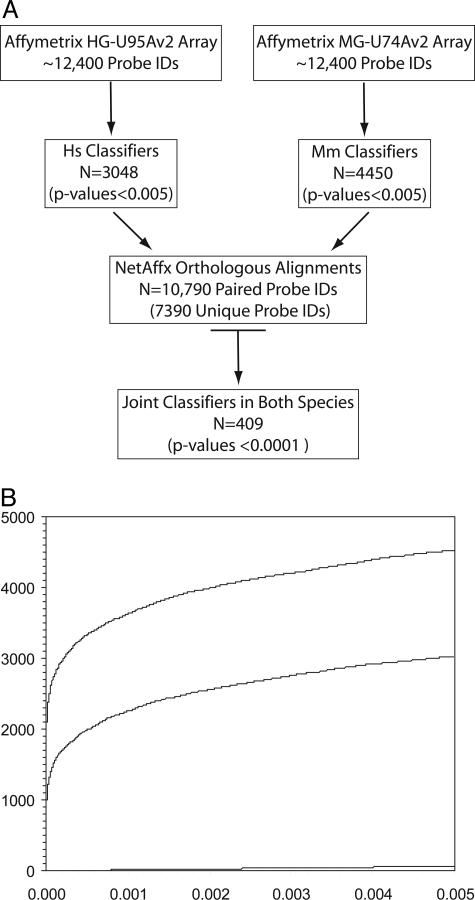
Figure 2.
A: Schematic representation of gene expression data analyses highlighting the approach used to define the overlapping set of joint classifiers between human and murine AC. In each case, the number of probe IDs underlying each subset is indicated. Human and murine data are indicated as Hs and Mm, respectively. B: Overabundance plot demonstrating the vast excess of highly significant genes identified by this analysis at any P value. The murine genes (top line), human genes (middle line), and null hypothesis (bottom line) are shown as a cumulative sum versus P value. The sharp rise for human and murine genes shown in the plot at a P value of 0.000 included probe IDs with P values <0.0001.

