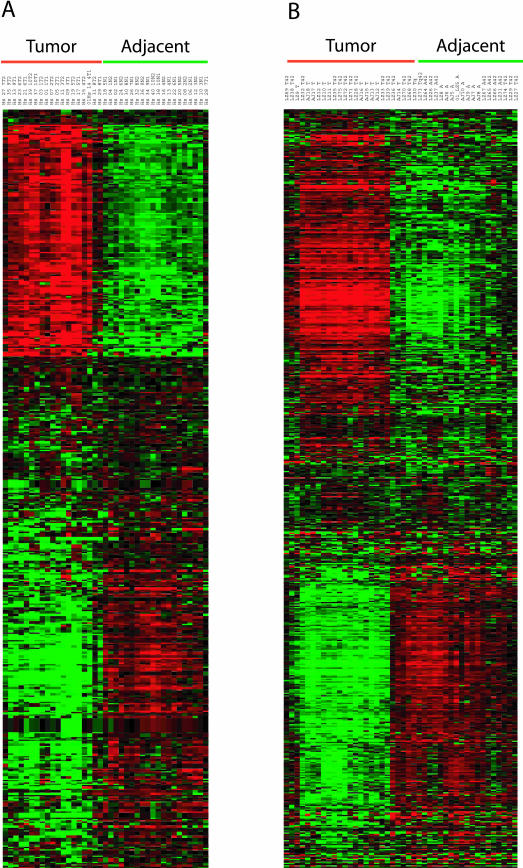
Figure 4.
Gene expression data for the 409 gene in the highly statistically significant subset is displayed using the Cluster and Treeview programs for the human (A) and murine (B) datasets. The data were log-transformed, median centered by genes and arrays, followed by hierarchical clustering by Spearman rank correlation centering. The GORDER option maintained a similar vertical ordering of the genes in both species. Green underlining indicates lung tissue adjacent to AC, whereas red underlining indicates AC tumor samples.

