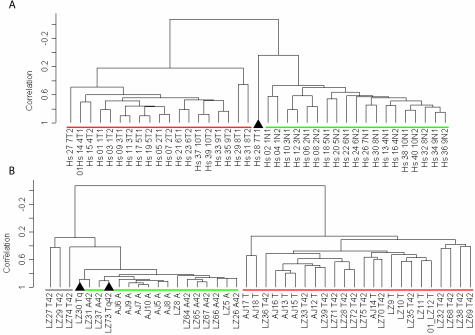
Figure 5.
Supervised clustering of human (A) and murine (B) gene expression data for the 409 genes in the highly statistically significant subset is displayed as a dendrogram. Black triangles indicate tissue samples not correctly identified (human 7T1 and murine LZ30Tq and LZ73 Tq42). The three murine samples underlined in gray were not clearly associated with either group. Green underlining indicates lung tissue adjacent to AC, whereas red underlining indicates AC tumor samples.

