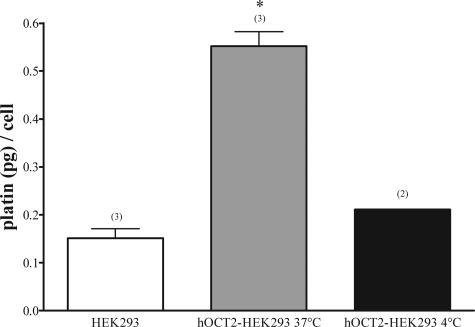
Figure 4.
Cis-platin accumulation in HEK293 (white column) and hOCT2-HEK293 (gray column) cells after 10 minutes incubation with 100 μmol/L cis-platin. Experiments performed with hOCT2-HEK293 cells at 4°C are also shown (black column). Values are mean ± SEM expressed as pg cis-platin per cell. *Statistically significant effect (analysis of variance, P < 0.05). Above the columns are the number of observations.

